Benchmark calculations
While the displayed benchmark values varies based on the measure, your profile's parameters and which peer group you're using to benchmark, the calculations to determine the values is the same. Remember that Clinical Analytics gives you the flexibility to use Internal Profiles or Peer Group Profiles for benchmarking.
NOTE: To help you get started, download our Benchmarks FAQs sheet.
NOTE: For more information about the effect of Grouping types on benchmark values, also check out the MS-DRG (Medicare Severity Diagnosis-Related Group) and APR-DRG (All Patient Refined Diagnosis-Related Group) pages in the Profiles section.
DRG weights
The primary reasons for risk-adjusting measure values is because we expect certain types of patients to require more resources than others. By retrieving benchmark values by APR-DRG/SOI (or MS-DRG), we are comparing similar patients when analyzing resource usage.
To help accommodate for this variability in resource usage, 3M calculates weights for every APR-DRG/SOI combination. This allows us account for patient Severity of Illness when aggregating multiple SOIs and/or APR-DRGs.
To help demonstrate this concept, see the following chart, which plots the weights for all 4 SOI levels of 6 APR-DRGs on a number line.
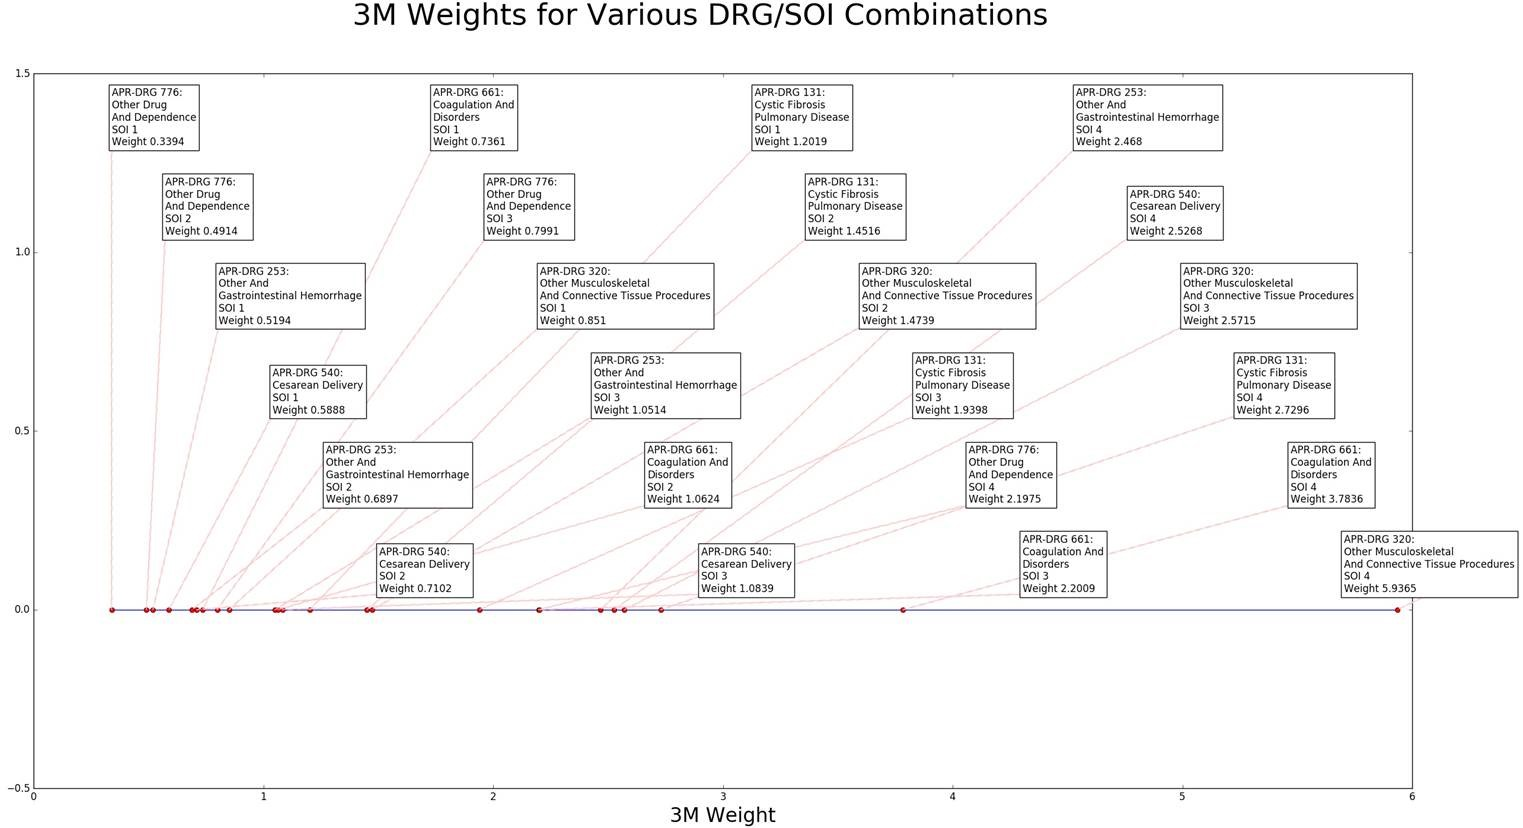
- First, notice that there is a correlation between the SOI and the weight, as we expect. There are mostly SOI 1's to the left side (low weight) and mostly SOI 4's to the right side (high weight), indicating that SOI 4 patients typically require more resources that SOI 1 patients.
- Upon closer inspection, we see that this relationship does not hold between DRGs. Notice APR-DRG 101 (Cystic Fibrosis Pulmonary Disease) SOI 1 has a weight of 1.2019 while APR-DRG 776 (Other Drug and Dependence) SOI 3 has a weight of only .7991.
NOTE: For this reason, we do not average SOI across APR-DRG. We incorporate the weight assignment when calculating CMI and always risk-adjust benchmark values to account for this known resource usage variability.
Severity adjustment
In order to demonstrate how Clinical Analytics computes a severity-adjusted benchmark value, let’s do a case study with some hypothetical values. In this example, we are looking at Total Cost for an internal profile with Grouping Type APR-DRG. Severity-adjusted Total Cost is an example of a Severity-Adjusted Resource Consumption Index – a measurement of the amount of resources that a hospital uses to treat its patients. It is severity-adjusted because we take each patient’s Severity of Illness into account when we compute a benchmark value.
In order to compute severity-adjusted cost and a benchmark, Clinical Analytics takes the following steps:
- Calculate the Total Cost for each internal encounter in our selected Profile.
- Calculate the benchmark value for Total Cost for each APR-DRG/SOI combination.
- For each hospital in the peer group:
- Calculate the Total Cost for each encounter.
- Find the median measure value for each APR-DRG/SOI combination within each hospital.
- For all hospitals in the peer group, calculate the user-specified percentile (50th, 75th or 90th) of this list of medians for each severity level. This is the benchmark value for the APR-DRG/SOI combination.
- For each hospital in the peer group:
- For each encounter, calculate Opportunity=Actual Value-Benchmark Value for that patient's APR-DRG/SOI combination.
- When grouping over multiple encounters, the Total Opportunity is the sum of the Opportunity values from each encounter.
- The Average Opportunity is the Total Opportunity divided by the number of encounters.
NOTE: The Benchmark calculation process is the same for all measures, as previously described. Note that Mortality measures use the APR-DRG/Risk of Mortality (ROM) grouping for risk-adjustment while all other measures use the APR-DRG/Severity of Illness (SOI) level when you select APR-DRG for your grouping type. When using MS-DRGs as your Grouping Type, all measures are risk-adjusted at the MS-DRG level. See Grouping types for more information.
Benchmark values in Clinical Analytics
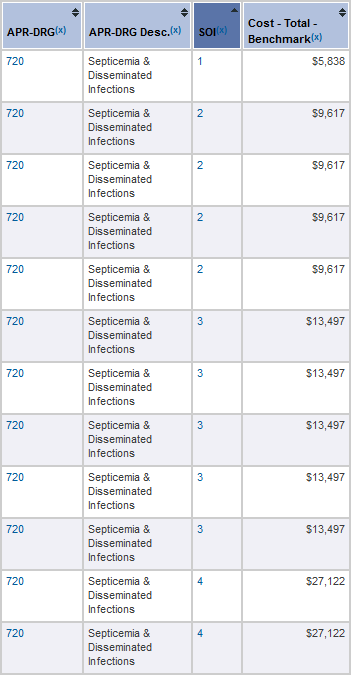
For every encounter included in the hospital profile, Clinical Analytics generates a benchmark cost value. By grouping by Axiom Encounter ID (the encounter level) in the Details Section, we see that this benchmark value depends on the encounter’s APR-DRG and SOI. Notice that for each encounter of a particular APR-DRG/SOI, the benchmark value is the same for all encounters of that APR-DRG/SOI, as expected based on the calculation steps described above.
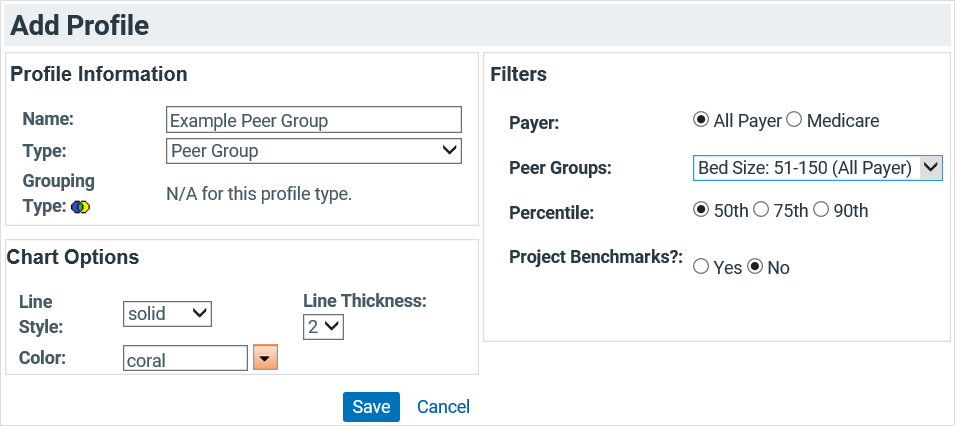
NOTE: Keep in mind that Benchmark Values also depend on the data sources and percentiles chosen in the Peer Group Profiles.
Rule of 11
A hospital in the Peer Group is included in the benchmark value calculation for a patient class if it has at least 11 encounters in that class for the time period defined by the Benchmark Profile. This is the Rule of 11; it helps ensure that the reported benchmark value is statistically significant and that the medical data from peer group hospitals remains sufficiently protected.
If the Rule of 11 is met, every encounter in the patient class and time period defined in the Benchmark Profile is considered. Since we are examining Total Cost in this example, we calculate the Total Cost for each encounter in the peer group.
Benchmark value calculation
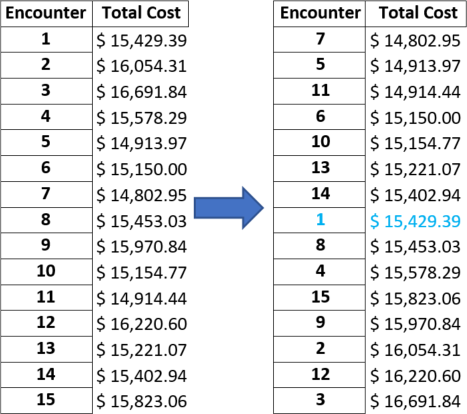
Consider the following Cost values for 15 encounters with APR-DRG 720 (Sepsis), SOI 4, at a facility in the peer group.
- Clinical Analytics orders these values and finds the median:
This operation is repeated for every facility in the Peer Group. This gives a list of median Total Cost values for APR-DRG 720/SOI 4 – one from each hospital in the Peer Group. For example, we have a list of the median values from 17 facilities. After sorting these numbers, we can identify our benchmark value to report in Clinical Analytics.
Notice above that the median (50th percentile), 75th, and 90th percentiles are highlighted. Depending on which percentile is chosen when customizing the Peer Group Profiles, one of these three values displays in as the Total Cost Benchmark Value for APR-DRG 720/SOI 4 patients.
Aggregate benchmark values
When benchmark values are aggregated over multiple encounters, the displayed Benchmark Value is the arithmetic average of all of the encounter-level benchmark values.
Opportunity calculation
Once we have encounter-level benchmark values, Opportunity is computed at the encounter level:
Encounter Cost Opportunity= (Encounter Total Cost) – (Benchmark Cost)When grouping multiple encounters, the Total Opportunity is the sum of the Encounter Cost Opportunity for each encounter. Average Opportunity is the Total Opportunity divided by the number of encounters. These calculations hold for all measures in Clinical Analytics, but we used Total Cost here as an example.
NOTE: Charge amounts and some other measure values are rounded, which may slightly affect some averages.
Remember that Average Opportunity is calculated by summing encounter-level Opportunity to get Total Opportunity, then dividing that number by the number of encounters. With that in mind, you may notice that the Average Opportunity is not always equal to the difference between the aggregated measure value and the aggregated benchmark value; this is not surprising when aggregating over multiple encounters.
See Opportunity for more details about the Opportunity values you see in Clinical Analytics.
Other adjustment calculations
In this example, we computed severity-adjusted cost, which is an example of a Severity-Adjusted Resource Consumption Index. Resource Consumption Indices measure the amount of resources used by the hospital to treat its patients.
As we have seen, Clinical Analytics takes the following steps:
- Calculate the value of the Index (measure) for each internal encounter.
- Calculate the benchmark value of the index (measure) for each APR-DRG/SOI combination.
- For each encounter, calculate Opportunity=Actual Value-Benchmark Value
- When grouping over multiple encounters, the Total Opportunity is the sum of the Opportunity values from each encounter. The Average Opportunity is Total Opportunity divided by the number of encounters.
The other severity- and risk-adjusted computations are done similarly. The summaries follow.
Severity-Adjusted Length of Stay index
A Severity-Adjusted Length of Stay Index is computed much like a Severity-Adjusted Charge index. Length of Stay for each encounter is computed as the number of days from admission to discharge, including the days of admission and discharge – if a patient was admitted on November 28 and discharged on November 30, the Length of Stay is 3.
As before, a Benchmark Value is computed for every APR-DRG/SOI combination.
Risk-Adjusted Mortality index
To compute a Risk-Adjusted Mortality Index, we segment encounters by APR-DRG and ROM (instead of SOI).
Computing the benchmark in this case is a slightly different process because mortality rate for a single encounter is not well-defined (typically 1 if the patient expired and 0 otherwise). Instead of computing a rate for every encounter in every Peer Group Hospital and taking the median of the individual values, the rate is computed for each APR-DRG/ROM group for each hospital:
Mortality Rate (for each APR-DRG/ROM)=(number of patients expired)/(number of encounters)After this rate is computed for each hospital in the Peer Group, Clinical Analytics calculates a Benchmark Value for the APR-DRG/ROM combination by determining the percentile specified in the Benchmark Profile, as described above. Again, opportunity is computed at the encounter level.
Encounter Mortality Opportunity= (1 if patient expired; 0 otherwise) – (Benchmark Mortality Rate)When grouping multiple encounters, the reported Total Opportunity is the sum of the Encounter Mortality Opportunity for each encounter. The average opportunity is the Total Opportunity divided by the number of encounters.
The Mortality Rate Index for a heterogeneous group of encounters (from different APR-DRG/ROM groups) is the average of the Benchmark Mortality Rates for each encounter in the group.
Severity-Adjusted Post-Operative Infection index
A Severity-Adjusted Post-Operative Infection Index is computed much like a Risk-Adjusted Mortality index, except that we segment encounters by APR-DRG and SOI (unlike Mortality measures where we segment by ROM.) A Post-Operative Infection is indicated by an ICD Diagnosis code for a Post-Operative Infection. For each hospital in the Peer Group and each DRG/SOI Cohort, the Infection Rate is computed as the number of encounters in the cohort with a diagnosis code for Post-Operative Infection divided by the number of patients in the cohort. The Benchmark Value is computed from the rates from all Peer Group Hospitals as before.
Wage Index-Adjusted Severity-Adjusted Resource Consumption index
A Wage Index-Adjusted Severity-Adjusted Resource Consumption Index is calculated in the same way as Severity-Adjusted Resources Consumption Index, except that the measure for each encounter is computed as the charge amount for the encounter divided by the hospital’s Wage Index as reported to CMS. After that, encounters are segmented by APR-DRG and SOI and benchmarks are constructed as in the other measures.
